Meetings are a lot of things. They’re costly, unproductive, and inefficient. But they’re also collaborative, inspiring, and actionable for driving growth at your company. The reality is, good meetings are good, and bad meetings are bad.
We’ve all been in bad meetings, but good meetings energize us, motivate the team, and lead us to great things. So when we think about the cost of meetings, it’s not always the time we spend in them, but the opportunities your team misses out on due to the chaos of a busy workspace calendar. In fact, employees average 17.1 meetings/week, yet 3.5 meetings are skipped and 4.2 are rescheduled every week. That’s almost half the meetings on the calendar that are impacted by scheduling conflicts.
In this trends report, we surveyed over 1,300 professionals on their meetings, which meeting types occupy the most time on their calendars, and the most common scheduling issues they face in their workplace. This data was collected in a research study in preparation for the launch of our Smart Meetings feature to understand how scheduling could be improved employee-wide across an organization using AI.
Let’s see how the meeting game is changing in 2024.
14.8 hours/week in meetings
Think you spend more or less time than the average person in meetings every week? It turns out, professionals are averaging 14.8 hours a week in meetings, down 31.2% compared to 21.5 hours of meetings a week in 2021.
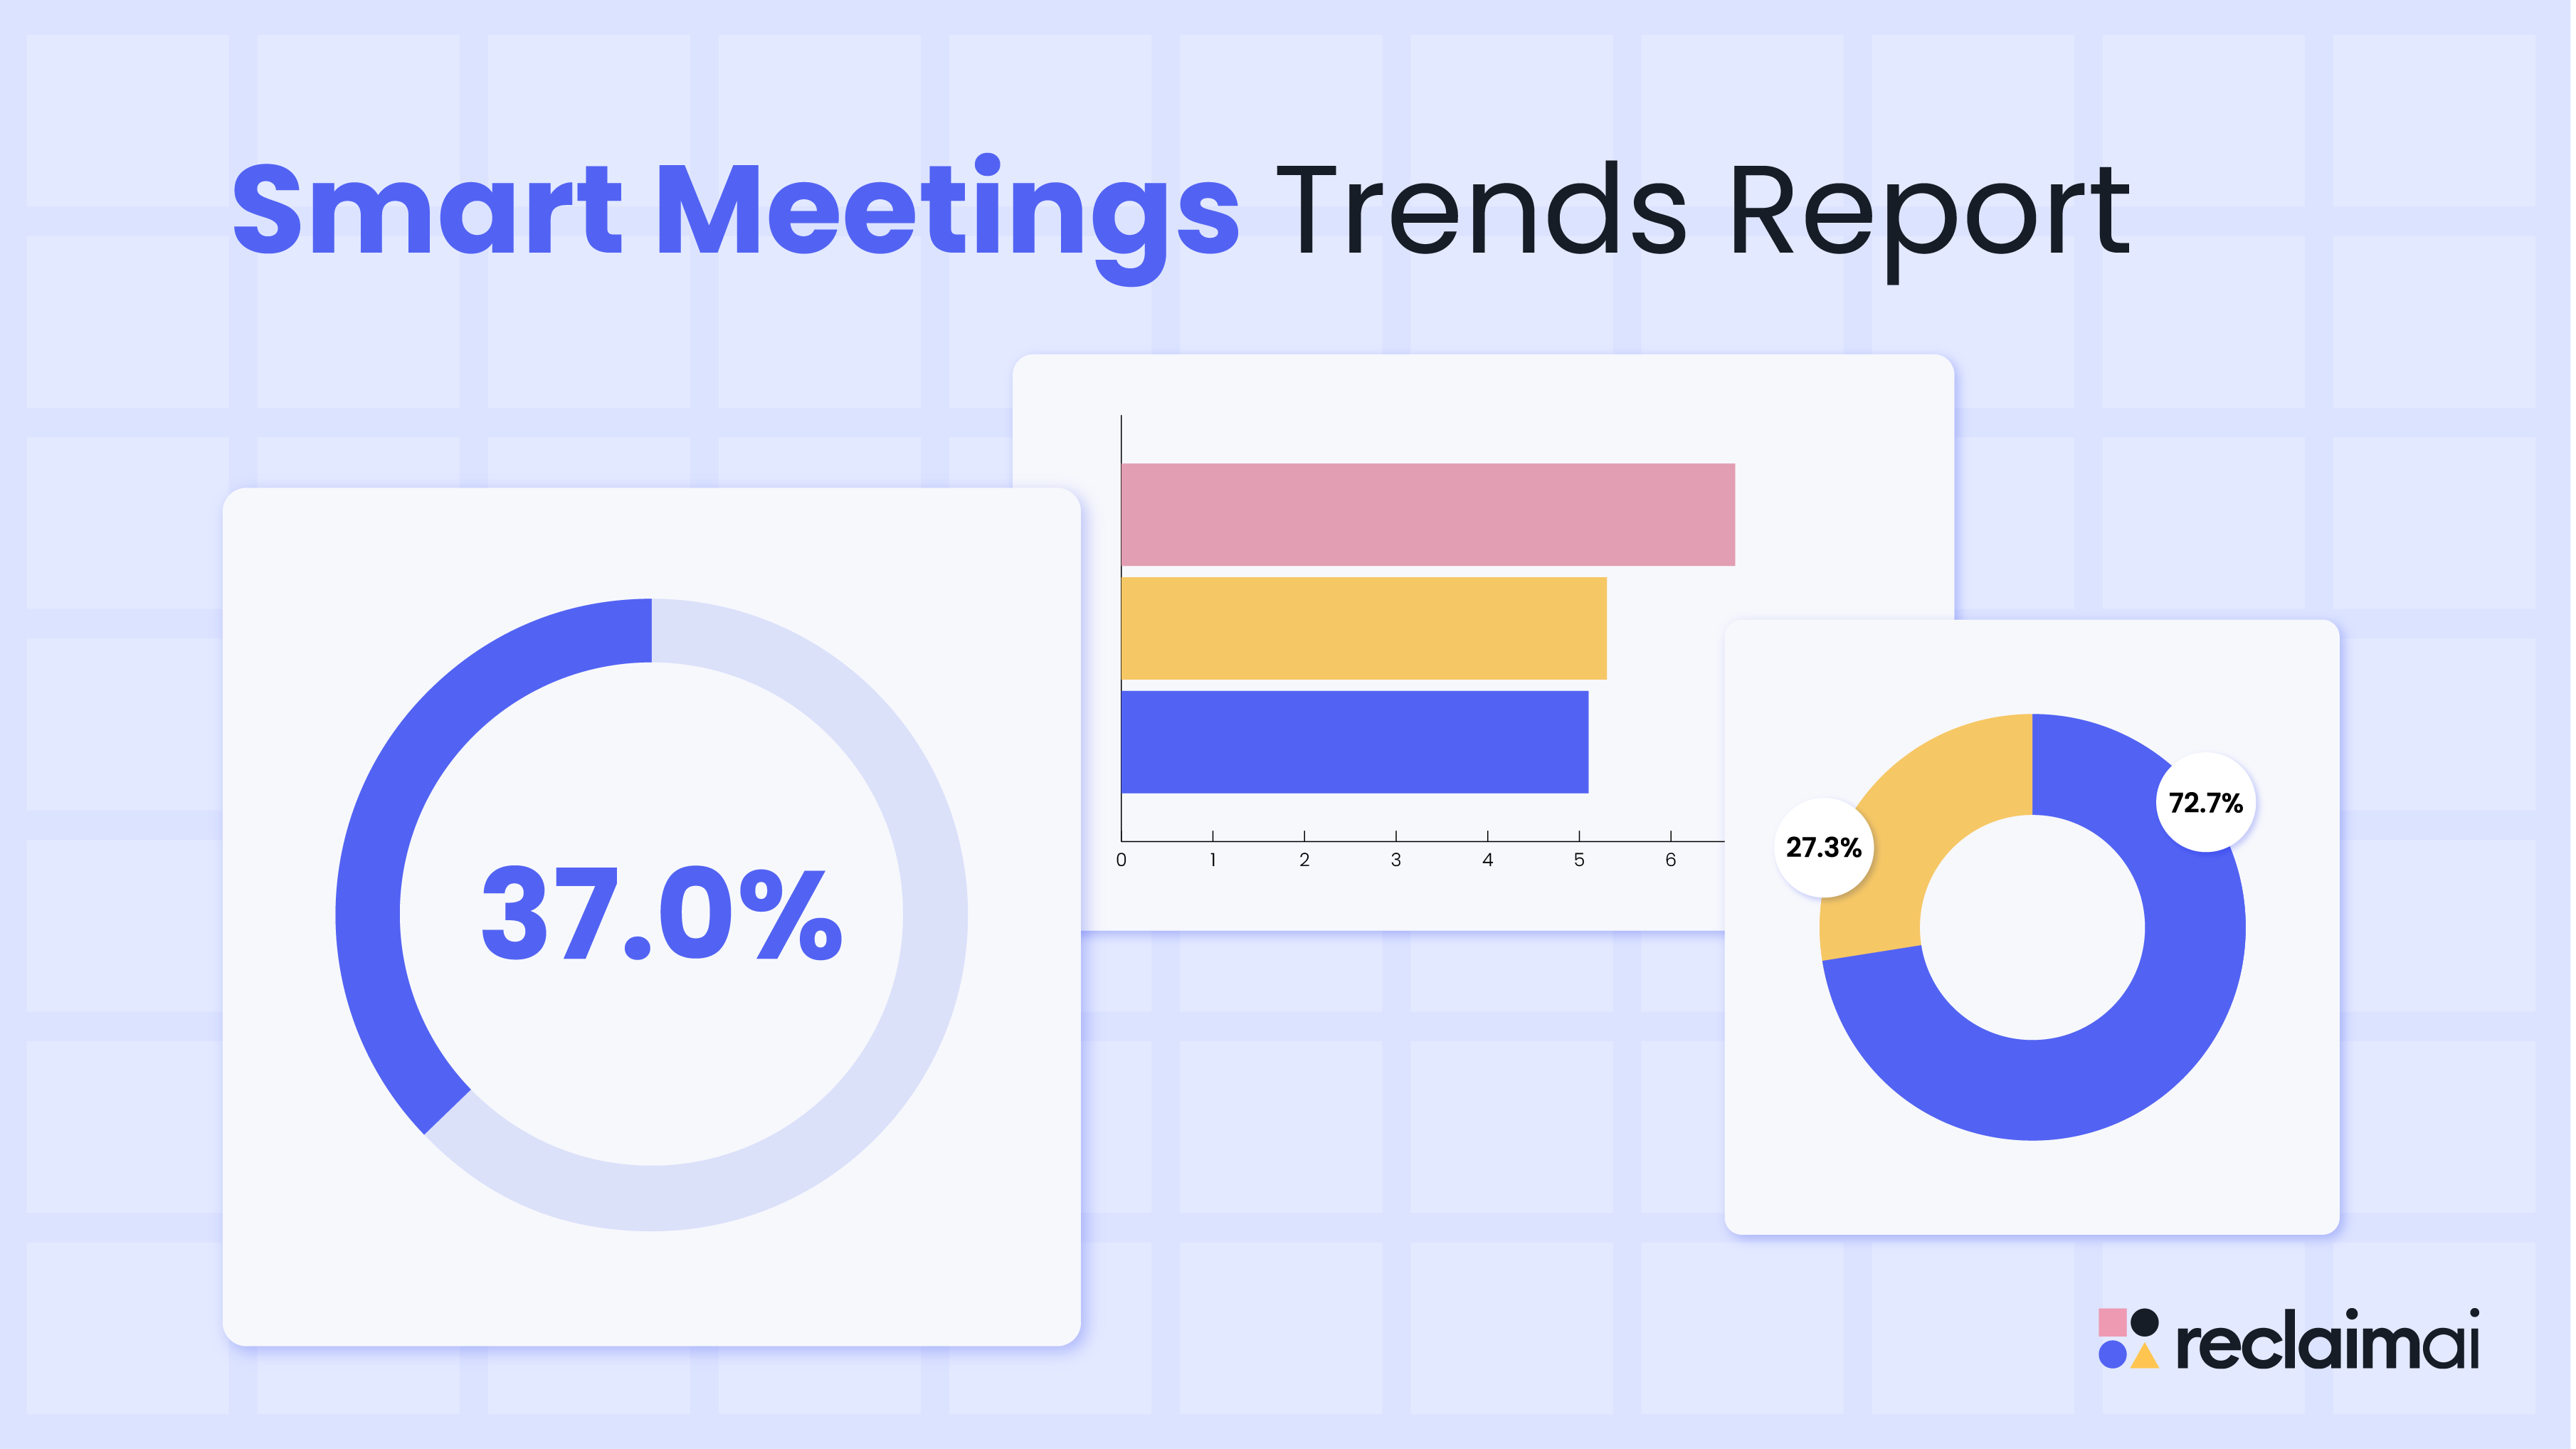
But even with this decline, professionals still average 37.0% of their time in meetings.

Let’s take a look at which departments average the most time in meetings every week:
- Engineering: 16.8 hours/week
- Product: 16.5 hours/week
- Finance: 16.5 hours/week
- Sales: 16.2 hours/week
- Founders & C-Suite: 15.9 hours/week
- HR: 14.4 hours/week
- Operations: 12.7 hours/week
- Support: 12.4 hours/week
- Design: 12.0 hours/week
- Marketing: 11.9 hours/week
Interestingly, people in more technical roles like engineering and product actually average more time in meetings every week vs. professionals in business development positions, like sales, founders, and c-suite executives. This is likely due to the increased need for internal syncs and team collaboration to execute the complex technical developments across these teams. Below we can compare how these departments compare in number of meetings vs. time in meetings.
What’s causing this decline in meetings? Back in 2021, the world shifted to a remote work environment where organizations and employees were trying to figure out how to balance and manage their time outside of an office setting. While remote work is still highly prevalent, we’ve really shifted to more of a hybrid workforce where teams are still operating across in-person and remote environments, but are again having more in-person spontaneous discussions than we were in 2021.
What’s the cost of meetings in 2024?
Average salary for employees in Q4 2023 was $59,384, multiplied by an average operational costs at roughly 1.325 times the base salary, the average annual cost per employee is $78,684. Since employees average 37.0% of their time in meetings, the average annual cost of meetings per employee is $29,129.

This means that the cost of meetings for the average company is:
- For companies with 100 employees: $2,912,900
- For companies with 5,000 employees: $145,643,200
- For companies with 25,000 employees: $728,216,000
So how much does a weekly team meeting cost for a group of five employees? That one weekly team meeting costs the organization $9,836 annually for the time spent by those five team members.
By reducing time in unproductive meetings by even 1 hour/week, a 5,000 employee company could save $9,835,500 in lost productivity every year.
Types of meetings attended
Which types of meetings do we spend time in every week? If you’re a manager or senior leader, you may spend a majority of your time in one-on-ones and team meetings. If you’re an individual contributor, you’re probably pulled into a bunch of different team meetings around the projects you’re involved in. And if you’re in sales, business development, or managing contractor accounts, you might find yourself in a ton of external meetings.
And while we average 14.8 hours/week in meetings, we actually attend 17.1 meetings/week. That means our average meeting length is 51.9 minutes. This has actually increased 2.6% since 2021 when meetings averaged 50.6 minutes in length.
Here’s a breakdown of the average number of each type of meeting professionals attend every week:
- 6.7 team meetings/week (39.3%)
- 5.3 one-on-one meetings/week (30.8%)
- 5.1 external meetings/week (29.9%)

As we can see, over 70% of employees' meeting time is spent in internal meetings collaborating with other members of their team.
So how do meeting types break down across the different departments in an organization?
As we can see, Finance professionals have the highest meeting load by far at 23.7 on average per week. And business development individuals like founders, c-suite executives, and sales people actually average more total meetings than more technical roles like engineering and sales who outpaced them as far as total time in meetings every week.
Let’s take a look at how the number of meetings compares to time in meetings to see which department averages the longest and shortest meeting durations across an organization.
Finance professionals, marketers, support, and design teams average the most efficient meeting lengths at under 50 minutes on average per meeting. While product and HR professionals average the longest meeting lengths at over 60 minutes per meeting.

Which group meeting types do employees attend?
There are many types of group meetings, or team meetings, that break out this most common type of meeting on the calendar. We asked survey participants which of these types of meetings they’ve attended in the past year:
- 95.7% have attended a team meeting
- 69.9% have attended a cross-functional team meeting
- 67.0% have attended a status update meeting
- 62.9% have attended a micro meeting (short meeting w/ only indispensable people)
- 56.1% have attended an all-hands meeting
- 55.2% have attended a customer meeting
- 55.3% have attended a department meeting
- 48.6% have attended a partner meeting

As we can see, team meetings are by far the most common, with nearly every member of the organization having attended one in the last 12 months. And not surprisingly, cross-functional team meetings are the next most common group meeting type, represented by almost 70% of employees. Cross-functional meetings are very essential to businesses, as professionals need to be able to connect with people in different departments to stay up to speed on what’s going on in the business, collaborate on new developments, and share feedback and experiences both from internal and external perspectives within the organization.
3.5 meetings/week declined, skipped, or canceled
As we can see, with so many meetings on the calendar, it’s impossible for everyone to make them all. While the average person attends 17.1 meetings/week, some people are only attending a few while others need to try to make close to 100 meetings fit within a single workweek.
It comes as no surprise that on average, 3.5 meetings are declined, skipped, or canceled every week. This means that we actually average 20.6 meetings/week on the calendar, but we are only able to attend 83.0% of them. And people aren’t just skipping meetings because they don’t feel they’re worth their time. The most common reason people cannot make a meeting is due to a scheduling conflict with another meeting on the calendar, and we break that data down further below.
4.2 meetings/week rescheduled
While some meeting conflicts cannot be salvaged, a majority of the time attendees scramble to reschedule a meeting to accommodate everyone in the group. On average, employees have to reschedule 4.2 meetings every week due to a lack of mutual free time available.
But with everyone managing such a significant meeting load, this is not a simple task. Attendees have to try to coordinate another available time across multiple peoples calendars, which usually requires extra negotiation to convince someone to move something around to free up time that works for the rest of the group. This burden unfortunately exacerbates the issue for the individual forced to adjust their schedule, which creates an endless trickling effect throughout the rest of their schedule and other meetings they have planned with their team.
What conflicts make people reschedule, cancel, skip, or decline a meeting?
So we know that meeting cancellations and rescheduling is a major problem across an organization – impacting over 37% of all meetings on the calendar. But what are the most common conflicts that cause us to have to manually readjust our schedules?
We asked people which of the following conflicts have made you had to reschedule, cancel, skip, or decline a meeting in the past year:
- 82.5% from over-scheduling with another meeting
- 79.3% to focus on a more important task
- 51.8% because it wasn't high enough priority to attend
- 49.0% because of PTO/vacation
- 47.3% because they were out sick
- 35.3% from a lack of new updates since the last meeting
- 33.7% because enough attendees weren’t able to attend
- 28.4% from being scheduled outside of their working hours (during personal time)

Surprisingly, it isn’t PTO or sick days where employees are actually not even working that is creating their meeting conflicts – it’s being overscheduled by other meetings. 82.5% of people had to miss or move a meeting because they had multiple meetings overlapping on the calendar. This puts employees in a challenging situation because they’re forced to determine – which meeting is higher priority for me to attend?
And almost 80% of people couldn’t make a meeting time because they had to focus on a higher priority task they needed to complete. This also interestingly correlates with our earliest Burnout Trends Report where we found the number one cause of burnout is the lack of time for focused task work. Employees are not only faced with decisions around which meetings to attend, but if they should attend a meeting at all or focus on their core work that needs to get done.
What percentage of team/group meetings are recurring vs. one-time meetings?
Let’s take a closer look at how meetings are scheduled at the calendar to identify what might be causing these massive scheduling conflicts so commonly faced across employees.
- 52.9% recurring meetings
- 47.1% one-time meetings

A majority of meetings on the calendar are recurring meetings, or repeating meetings, that are set to continue scheduling at a regular interval. These meeting types are set on auto-pilot, without any consideration for the availability of the attendees every day, week, or month that they’re set to recur.
One-time meetings on the other hand, often require the organizer to meticulously review all attendees calendars to identify mutual free time for everyone. The problem is that our calendars are changing all the time, so while a one-time meeting appeared to be scheduled without conflict in the morning, it could be overscheduled for multiple participants by the end of the day.
What percentage of team/group meetings are scheduled vs. spontaneous meetings?
Now that we understand what percentage of our meetings are recurring vs. one-time meetings on average, how many of our meetings are planned vs. spontaneous?
- 72.7% of meetings are scheduled and planned
- 27.3% of meetings are spontaneous and unplanned

As you’d expect, a majority of the meetings on the calendar are scheduled and planned, and these likely include most of your recurring meetings and a good portion of your one-time meetings.
But what’s really shocking is that 27.3% of meetings on average are unplanned and spontaneously thrown together to connect on an urgent topic. This is an extremely symbolic finding, because it really highlights just how quickly priorities can change across an organization, and the immense need employees have to be able to stay flexible to accommodate these crucial business opportunities that can pop up any moment.
What’s the cost of managing meetings?
So we took a look at the average annual cost of meetings per employee earlier in this report, but how much time do people spend every week just managing all the meetings and rescheduling of their calendars?
On average, employees spend 3.0 hours/week managing their meetings, or 36 minutes/day. This includes everything from setting up the meetings, coordinating schedules, negotiating times, as well as canceling their meetings and rescheduling around all the last-minute conflicts in their calendar. And this time isn’t just spent in their calendars, it includes back-and-forth scheduling emails, finding meeting times over Slack, even walking to a coworkers desk in-person to see if they can adjust their schedule for the sake of the group.
While these seem like little tasks that just take a minute, these tasks add up fast and average out to an astonishing 7.5% of employees total time at work.
So again if we’re considering the average cost of a full-time employee is $78,684 per year, the average annual cost of employees managing their meetings manually is $5,914. And with 132,550,000 full-time employees in the United States, the US annual cost of employees managing their meetings manually is $784 billion dollars.

By automating just 2 out of 3 of those hours employees spend every week managing their meetings, a 100 person company could save $394,300 per year.
The future of meetings is AI
At Reclaim.ai, we care about these numbers because we are working every day to transform the future of meeting scheduling with AI to save employees precious time, but more importantly – solve the real business problem organizations face around their employees not being able to find enough time to collaborate and be productive in their roles.
We are very excited to share the launch of our newest feature, Smart Meetings, which allows teams to automatically find the best time for their recurring meetings across everyone’s schedules using AI. And most importantly, auto-reschedule to the next best time around priority changes and meeting conflicts. In the few short weeks since beta testing began, Smart Meetings are already saving users thousands of hours in manual scheduling and ensuring their most important meetings stay on the books.
As we’ve all experienced, scheduling is hard, and the more people who need to be in a meeting makes it exceedingly more difficult to identify mutual free time. But with smart priority levels across both meeting and focus time events, employees can confidently put their schedules on auto-pilot with the peace of mind knowing they’ll always stay in touch with their teams.
Trend Reports
Ready for an AI calendar?
Auto-schedule your tasks, habits, breaks, & meetings on Google Calendar.
Start scheduling →It's free! 🎉


.svg)
.svg)
.svg)
.svg)
.svg)